Identifying whether or not someone is experiencing stress is one of over 100 techniques we discuss in our DISC & Motives Certification course. In this article, I discuss how to use our DISC and Motives report to identify if someone is experiencing stress AND whether that stress is likely originating from work or home. In future articles, as well as during our DISC & Motives Certification course, I will show you how to use the report to decrease that stress.
First things first: How do you use our DISC report to identify If someone is experiencing stress?
We use the percentage numbers on the DISC graph page to give us insight on whether or not someone is experiencing stress. These are the numbers at the bottom of the page under each D, I, S, and C column. Go to any of our DISC reports to more clearly see an example of this. I use a sample report to give an example below.
The Technique
The easiest way to assess whether someone is experiencing stress via our DISC report is the following. Look at the two DISC behaviors graphs. The greater the difference in the percentage scores between the
D, I, S, and C Adapted graph and the Natural graph, the greater the likelihood the person is experiencing stress. We identify the likelihood the person is experiencing stress in two different ways.
- If the difference for any ONE of the D, I, S or C columns on the Graph I (Adapted) and Graph II (Natural) is greater than 20 percentage points, there is a likelihood the person is experiencing stress regarding behaviors on that one DISC dimension. We recommend using a difference of at least 20 percentage points before we suspect the person is experiencing stress. The larger the difference number is, starting at a 20 percentage point difference, the greater the potential the person is experiencing stress.
- If when you add up the differences on ALL FOUR DISC dimensions (between Graph I and Graph II) there is a greater than 40 percentage points difference, we suspect the person is also experiencing stress. The cut-off here is a minimum score of 40 percentage points. The greater the difference score across all four D, I, S, C dimensions, the greater the likelihood the person is experiencing stress. The greater the difference on ANY ONE dimension, the greater the likelihood the stress is coming mainly from those types of D, I, S, C behaviors. If the difference is large on several different D, I, S, C dimensions, the stress is likely originating from a combination of D, I, S, C behavior factors.
Let’s look at a specific DISC graph example.
We are using a sample report and not the graphs of a real person. This is the process we recommend you use to identify if the person is experiencing stress:
1. Go to the DISC graph page and identify if the Adapted Score and the Natural Score on the DISC graphs are different from each other or relatively the same. Determine if there is a difference on any ONE D, I, S, or C dimension of 20 percentage points or more OR a total score difference across all FOUR dimensions of 40 percentage points or more.
2. To calculate this, look at the scores at the bottom of the page under each D, I, S, and C column for the Adapted and the Natural Style graphs. This page is near the end of the DISC section of your report. We have reports that are DISC only, DISC & Motives only, and DISC, Motives, & Leadership OR DISC, Motives, & EQ only. So, the exact page of where the graphs are located will vary depending on the report you are using.
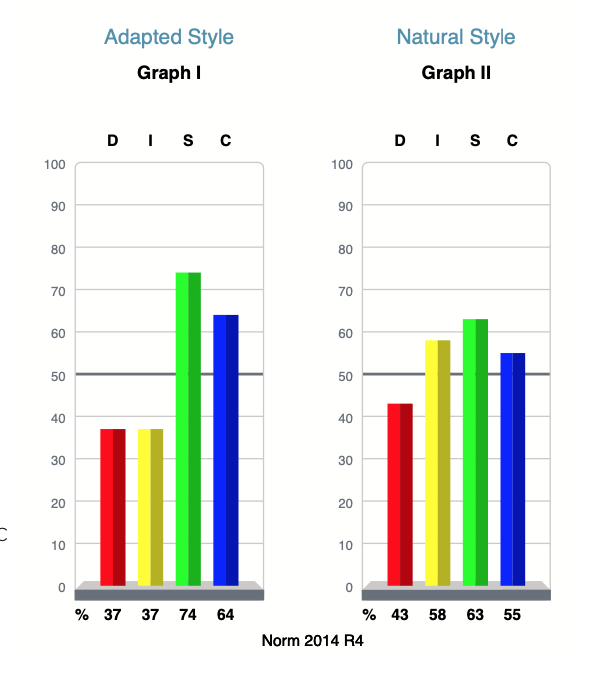
3. Subtract the “D” score on the Adapted Style Graph from the “D” score on the Natural Style Graph. For our sample, the difference is only 6 percentage points. The “D” characteristics are not contributing to stress.
4. Do the same for each of the FOUR D, I, S & C dimensions for our sample and we see a different picture. We are interested in the “absolute” score, which means ignore the plus or minus sign. We are interested in just the DIFFERENCE between the two graphs for the D, I, S, and C behaviors.
The calculations for our sample report are:
a. The “Adapted D” is 37. The “Natural D” is 43. The difference is 6 percentage points
b. The “Adapted I” is 37. The “Natural I” is 58. The difference is 21 percentage points.
c. The “Adapted S” is 74. The “Natural S” is 63. The difference is 11 percentage point.
d. The “Adapted C” is 64. The “Natural C” is 55. The difference is 9 percentage point.
e. The DISC dimension with the greatest distance between the Natural and the Adapted percentage score is “I” at 21 percentage points.
f. The total percentage difference score for all four dimensions is 6 + 21 + 11 + 9 = 47 (Again,
to calculate the difference score, we look at the difference for all four dimensions and add them together).
5. When we look at Graph ! and Graph II differences we see:
a. Our sample’s “I” score at work (the Adapted graph) and their “I” score when they are by themselves (what they prefer in life measured
by the Natural graph) is 21 percentage points LOWER at work. Our sample may be experiencing stress because they cannot be themselves at work. For some reason their ability to interact and talk with others related to work, and other “I” characteristics, is much lower at work than they prefer.
b.Their “S” and “C” scores at work are slightly higher than our sample prefers. This means that their “S” like behaviors and his “C” like behaviors are all higher at work than they prefer. By themselves, these higher “S” and “C” behavior needs at work have little impact on their stress. Combining the differences between their “I”, “S”, and “C” scores DO suggest our sample is experiencing stress at work.
The above technique gives us insight into the extent the person may be experiencing stress at work AND gives us insight as to where that stress may be originating. During a conversation or interview with our sample person it will be important to “test out,” by asking them questions, if they are experiencing stress at work. Knowing the potential cause for something gives us insight on how to treat or decrease the stress. Knowing how the person scored on the Adapted and the Natural DISC Graphs gives us significant insight on what to do next. Remember, reports should be validated, and used as structured interviews. There is a need to talk with our sample to validate the report and not just assume the report is totally correct. Our reports are amazingly accurate, but they are not perfect.
In another article we will discuss some possible ways to decrease the stress people are experiencing. If you can, examine some of the reports you have already purchased from us and see if you can identify any of them that may be experiencing stress.